The record
What the market has actually paid
The cars that fit the rule, as one cohort, against the ones that did not. Hover a year for both figures.
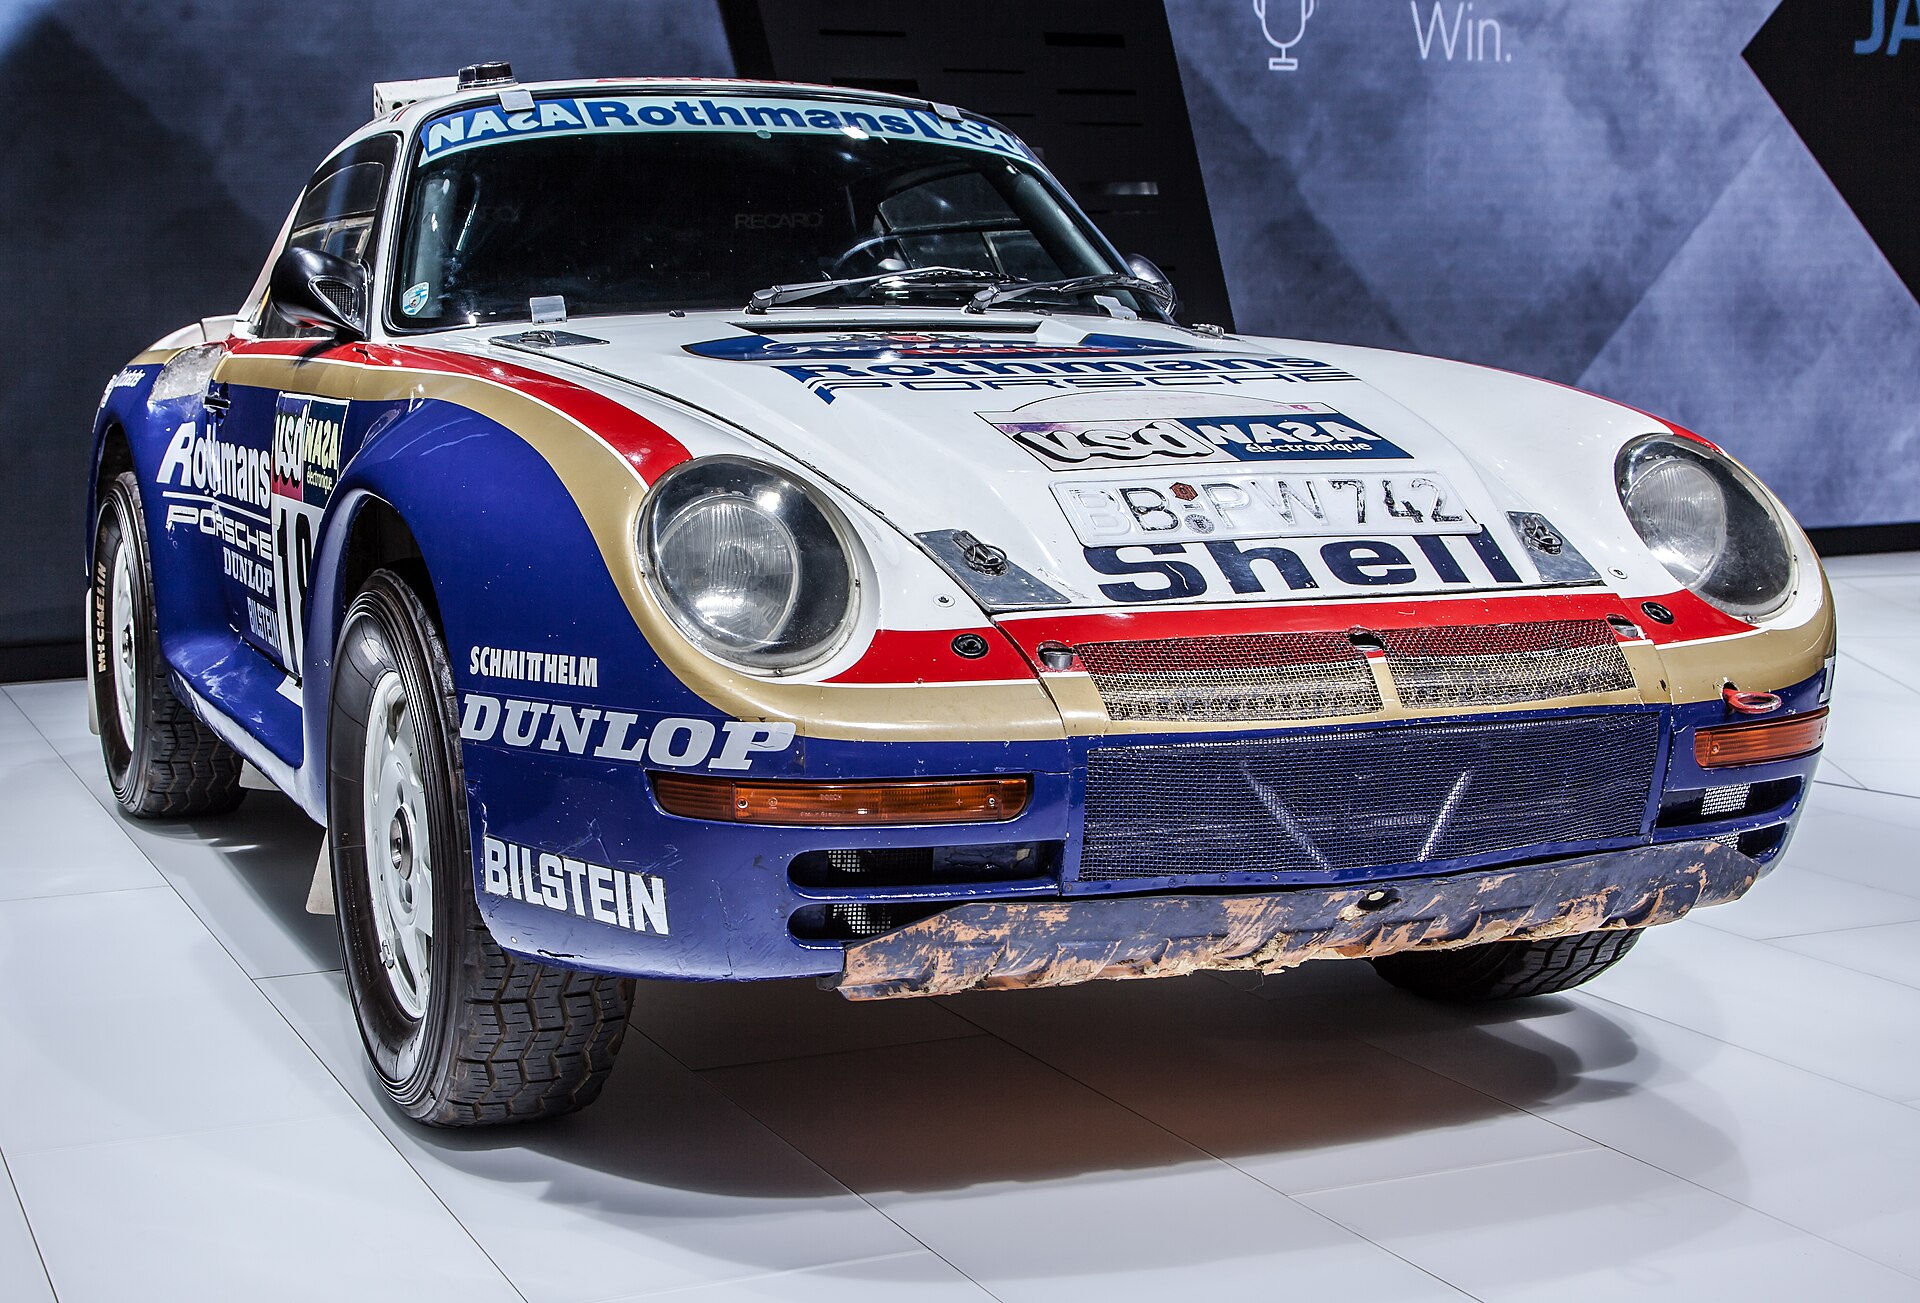
Porsche 959, 29 S built
The cohort against the control group
Value since 2014: the cars that fit the rule, 4.6×. The rest, 1.4×.
The hold
The hold decides the multiple
Across the thirty-nine models, August 2011 to February 2026, cars sold after ten years or more returned a median 2.77×. Choose the other hold to compare.
In five lines
The record, read honestly
Every figure here is the market’s record, not ours. The fund is newly formed and has no operating history.
The database is built from Classic.com sold results and the auction houses’ own pages, with non-dollar sales converted at fixed rates and conversions, replicas and re-badged cars excluded. Each model’s record is read whole: the yearly median, the record sale, the low, and the window since the car’s first recorded sale. The multiples and the index are drawn from the analytical master through February 2026; the count of sales runs to October 2026.
- 39
- models in the investable universe, each built in a closed run and sorted into five tiers by how proven it is.
- 43,377
- auction results in the database, 1,135 of them sales of the thirty-nine models, August 2011 to October 2026.
- 10.9%
- a year, the median compounding of the cars that fit the rule, against 5.4% for the ones that did not.
- 2
- of the thirty-nine lost money over their window. In four of the last twelve years, half the models or fewer rose against the year before.
- 0
- realized trades of any Sabas fund. The record is what the market has done with these cars; the materials say what we intend to do with it.